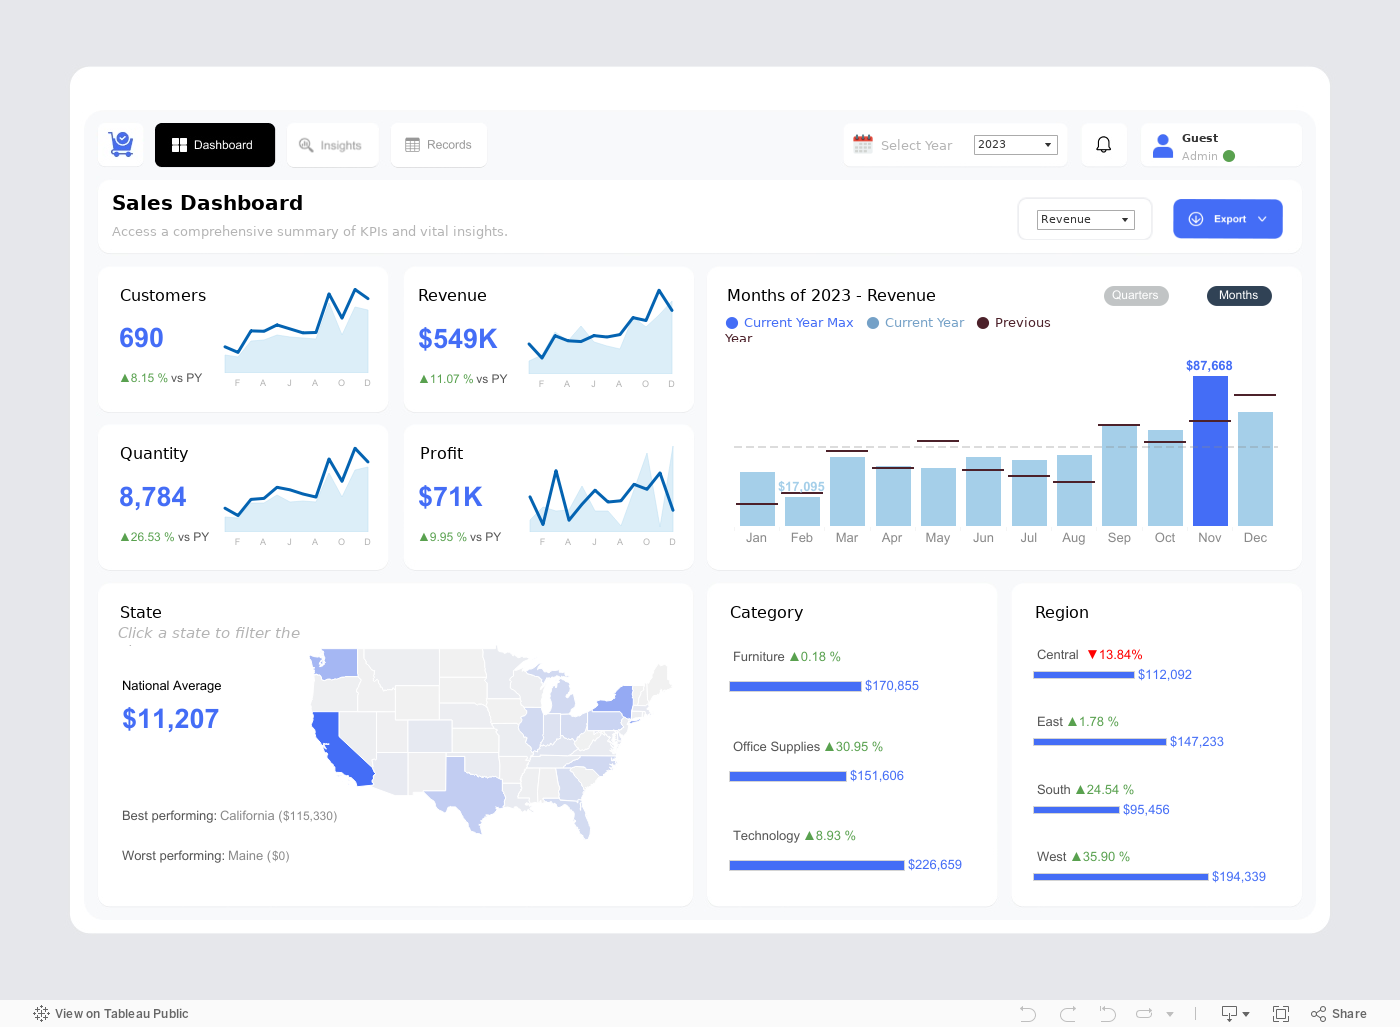
Explore a dynamic and interactive Tableau Sales Dashboard designed to provide a comprehensive summary of key performance indicators (KPIs) and vital insights. The dashboard showcases real-time data on customers, revenue, profit, quantity, and performance by state, category, and region. Compare year-over-year performance, analyze trends, and identify growth opportunities with visual breakdowns of revenue by month and category. Gain actionable insights with detailed metrics and graphical representations tailored to optimize decision-making and strategy development.